The result of the mass spectrometry is given on the form of a histogram giving the abundance of species as a function of their m/z ratio (we write it M as well, as the ions are usually monocharged). It is called a spectrum of mass. The abundance is given in % of the largest peak. No matter how many fragments there are, there will always be a peak with an abundance of 100% and the other peaks have smaller abundances.
Fragments of low m/z are on the left and the parent ion is, eventually, on the right extremity of the spectrum. The parent ion is the molecule that has been ionised but did not generate any fragment. We can refer to its peak as the parent peak or the M peak. Its peak is not always present on the spectrum or it can be small. It is more common to have an intense parent peak in the case of a chemical bombardment for which a peak at M+1 is also intense. Peaks with a larger M than the substrate can eventually exist because of the isotopes.
Rule of the nitrogen
The rule of the nitrogen is a pretty simple rule that tells that if the mass of the parent ion is even, there is an even number of nitrogen in the molecule. If the mass is odd, then the number of nitrogen is odd as well. For instance, there is no nitrogen in C2H6 and the mass is odd: 2×12+6=30. The nitrogen can wear one less hydrogen (NH3) than a carbon (CH4). If we replace one of the carbon by a nitrogen but also has an odd mass, we will have CH3-NH2 with a mass of 12+14+5=31. If we were in presence of NH2-NH2, the mass is odd as there are two nitrogen’s (M=32).
Furthermore, the M peak is usually weak if there is any nitrogen in the molecule.
Isotopic peaks
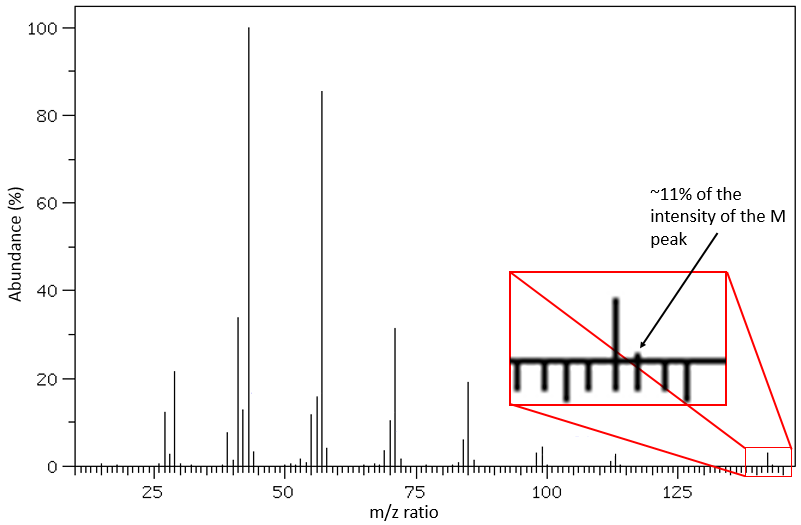
It is pretty rare when a peak is not directly surrounded by other peaks of lower intensities. Those clusters are due to the presence of isotopes in the fragments. The abundance of 13C is low: 1.1% by carbon in the chain but peaks at M+1 (M being the m/z ratio without isotope) can be observed if the intensity of the main peak is large. It is also possible that two 13C are on the same fragment, leading to a very small peak at M+2. We can estimate the quantity of carbons in the substrate from the intensity of the M+1 and M+2 peaks. The intensity of the M+1 peak is equal to 1.1%n of the intensity of the M peak, with n the quantity of carbon (we also add 0.36% for each atom of nitrogen N in the molecule). Yet, heteroatoms such as O, N and S can also increase the intensity of the M+1 peak. This tip is thus not absolute.
Other atoms can easily be distinguished by the intensity of their isotopic peaks at M+2. Cl and Br have isotopes with high abundances. Fragments possessing one of those atoms can easily be spotted on a mass spectrum. S also shows a peak at M+2 of approximatively 5% of the M peak by atom of S. O shows a very small peak at M+2 (O.2% by atom of oxygen). Finally Si has isotopes giving visible M+1 (5.1%) and M+2 (3.35%) peaks.
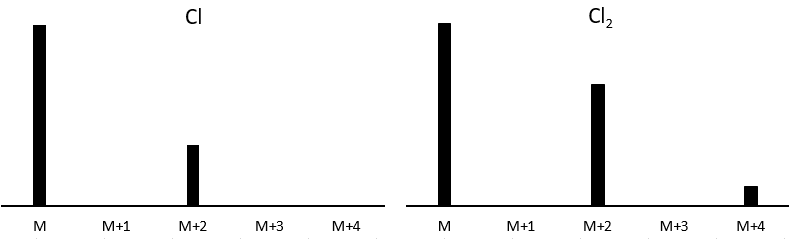
Cl has two stable isotopes: 35Cl and 37Cl. Their abundances are respectively 75% and 25%. On the spectrum, it results in a peak at M+2 with an intensity that is the quarter of the main peak. If there are two Cl on the same fragment, both can be 35Cl or 37Cl or we can have one of each. We will thus have a peak at m/z=M, M+2 and M+4. The intensity of the peaks is still related to the abundance of the isotopes. To make it simple, there are 3 chances on 4 to have a 35Cl and one chance on 4 to have a 37Cl for each of the Cl. We can draw the following table and write the corresponding peak in the cases for the corresponding combination.
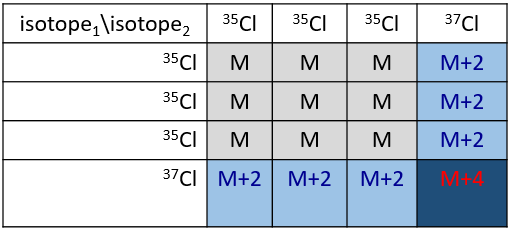
There are 9/16 of the fragments that will have the mass M, 6/16 the mass M+2 and 1/16 the mass M+4.The most intense peak is still the peak with two 35Cl. The intensity of the peak with one 35Cl and one 37Cl at M+2 represents 2/3 of the intensity of M and the peak at M+4 with two 37Cl a bit more than 10%.
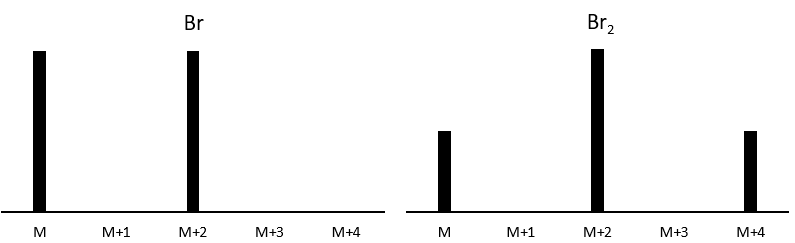
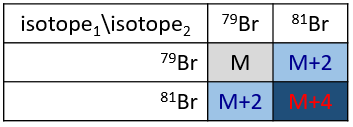
The abundances of the isotopes of Br are approximatively equivalent. If one atom of Br is on the fragment. Two peaks of similar intensities are separated by 2 units of mass. If two Br are on the fragment, the main peak is the one wearing one 79Br and one 81Br (M+2). At M and M+4, the peaks have half of the intensity of M.
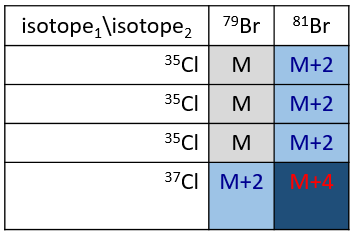
If the fragment has 1 Cl and 1 Br, then we have
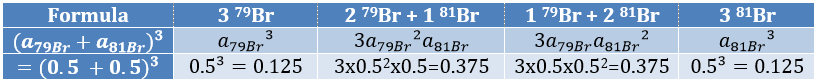
The relation between the intensities of isotopic peaks (for one type of isotope) is given by the development of the power of a sum

where ai is the abundance of the isotopes i of the atom and n is the number of atoms of the isotope in the fragment. For the example of the bromine, there are two isotopes with equivalent abundances (50%). If there are three atoms of Br in the fragment, we should observe a repartition similar to
Fragmentation peaks
Now that we have analysed the parent peak, we have some advices on the nature on the substrate but we can only guess which molecule it is. A simple example: how would we know if the substrate is the n-octane of the 2-methylheptane?
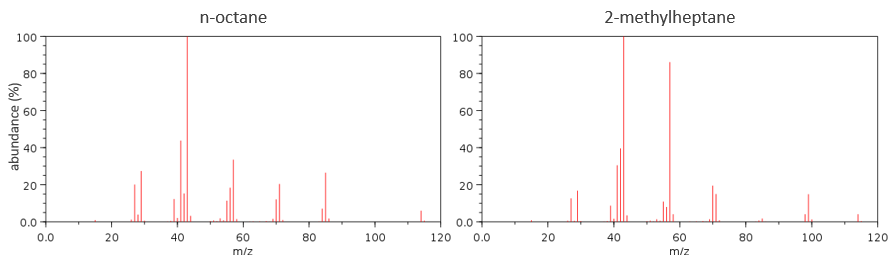
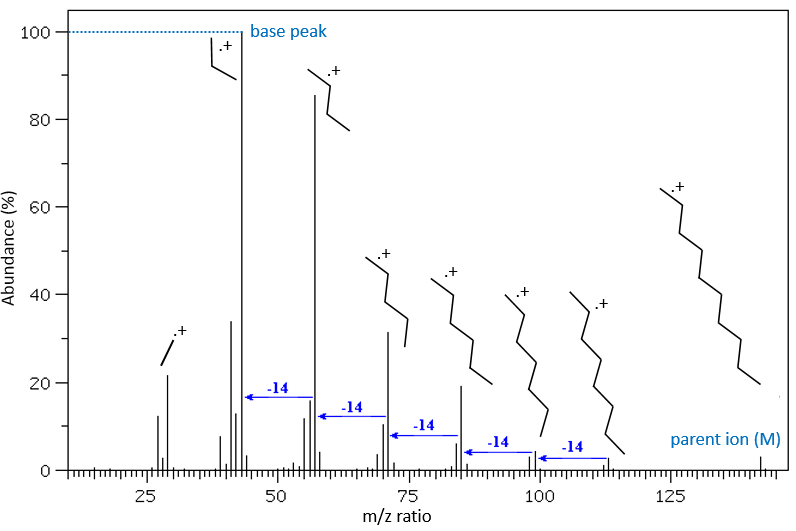
The fragments peaks can help us to find out. To talk about the fragments, we refer to peaks by their m/z ratio. For instance, we can say that the parent ion is at M=m/z=114 and that the base peak is at m/z=43 for both species, and that they have peaks in common (m/z=29, 43, 57, 71 and 114). The intensities of those peaks are not identical and the n-octane shows a peak at m/z=86 and no peak at m/z=99. The fragmentation was thus different because of the structure of the molecule, the composition being identical.
Imagine now that we only knew that the two molecules are alkanes. From the parents ion we can determine that both of them are a form of octane. The interest of the fragmentation peaks will be to give us advices on the structure of the alkanes.
It can be useful to draw the molecules of our guess and cut them into fragments. Virtually, the molecule can break anywhere. A method is to draw the semi-developed representation of the molecule.
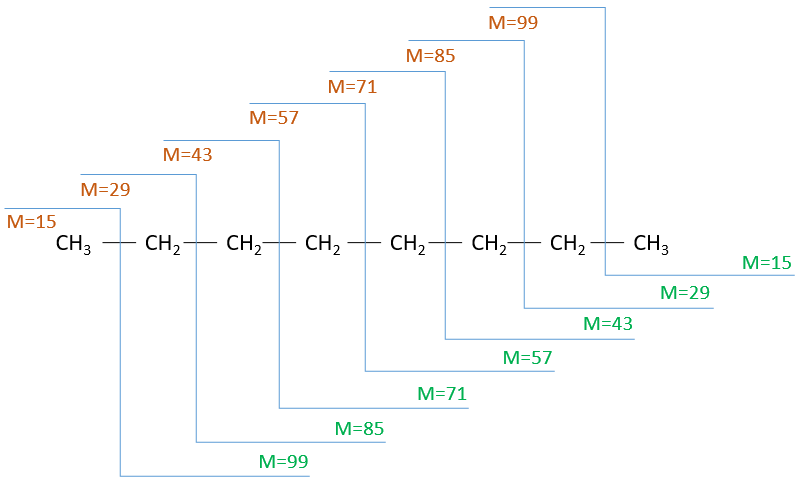
To represent the fragmentation at one liaison, we draw a line perpendicular to the liaison and indicate the masses of the fragments at the left and right of the liaison (respectively in orange and green on the figure above). The Z shape drawn on the figure above is more convenient than a simple line in the case of more complex molecules. For instance, if the n-octane is cleaved after CH3-CH2, the fragment of the left has a mass of 29 (units of mass) and the second fragment, i.e. the rest of the molecule, has a mass of 85. These fragments can be found on the spectrum of the n-octane and have approximatively the same abundance. Unfortunately, the abundances of two complementary fragments are not linked. Remember that when we obtain a fragment, only one side of the molecule remains charged and is detected by the MS, the second fragment being neutral and thus not detected.
![]()
One can see that the fragmentation at the level of the –CH3 does not appear on the spectrum. It is because the probability of fragmentation for a given liaison is related to the strength of the liaison, to the possibility of a low energy transition and to the stability of the generated fragments. In general, the intensity of the peaks are not identical and it is common to observe one or two very intense peaks amongst the fragmentation peaks. Some general rules may help us to predict the nature of the most intense peaks:
- the intensity of the M peak is the highest for linear chains and decreases with the degree of ramification. One can see it on the previous figure.
- the intensity of the M peak decreases with the mass of the substrate (for similar structures). The fat esters are an exception.
- aromatic compounds usually show intense M peaks. Double liaisons, cycles and aromatic cycles stabilise the molecular ion, leading to an intense M peak.
- the fragmentation is favoured at substituted carbons because it leads to carbocations that are more stable. The series for the stability of carbocations is
![]()
The rule is thus similar to the one for the stability of carbocations for SN1. The biggest substituents are usually removed more easily and there is usually no peak at M-15 because CH3+ is not stable. If a peak is present at M-15, it definitively means that there is a ramification in the molecule.
- Double liaisons favour the allylic cleavage to stabilise the carbocation.
![]()
- liaisons nearby heteroatoms are frequently broken because of the possible stabilisation of the charge by resonance.
![]()
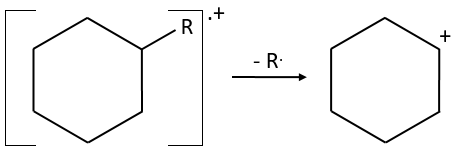
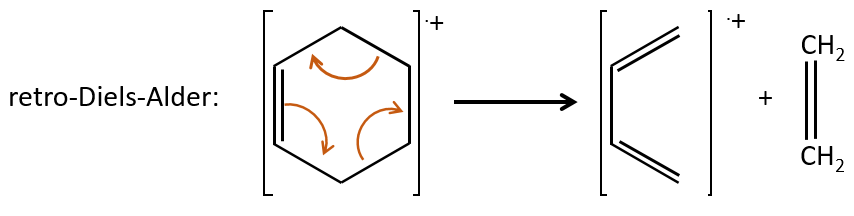
- saturated cycles usually lose alkyl chains and keep the positive charge. Unsaturated cycles are subject to a retro-Diels-Alder reaction.
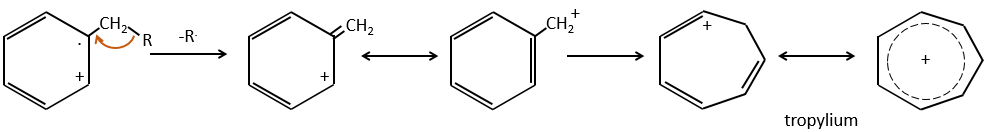
- aromatic cycles usually keep a methyl group and fragment in beta of the cycle to stabilise the positive charge and give the tropylium ion by rearrangement.
- the cleavage is favoured when small neutral molecules can be removed, such as water, H2S, NH3, HCN, CO, etc.
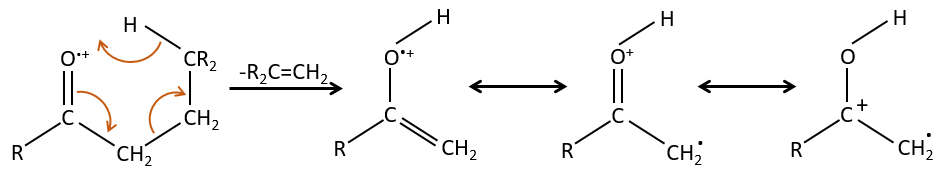
- rearrangement of Mc Lafferty if a hydrogen is in γ of carbonyl. Some fragments cannot be explained be simple cleavages of liaisons from the molecular ion. Such fragments can be the result of an intramolecular rearrangement. The rearrangements often involve the migration of a hydrogen atom on a heteroatom. For instance, a hydrogen in γ of carbonyl can migrate on the O.+. The resulting cleavage is done on the liaison in αβ of carbonyl. It is called a rearrangement of Mc Lafferty.
Typical fragments
There are two ways to look at the fragmentation peaks, and they are used together. The first way is simply to determine what they can be from their m/z, as we have done with the parent peak. There are tables of possible ions corresponding to each m/z ratio.
Here comes a list of some characteristic ionic fragments (that are thus detected on a spectrum):
M between 19 and 25: unusual except if there is a O or F.
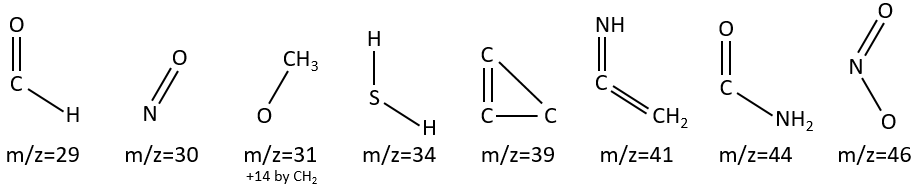
M=29: presence of an aldehyde.
M=30 (or 46): presence of a nitro.
M=31+n14: presence of an etheric oxygen.
M= 34: presence of a primary -SH.
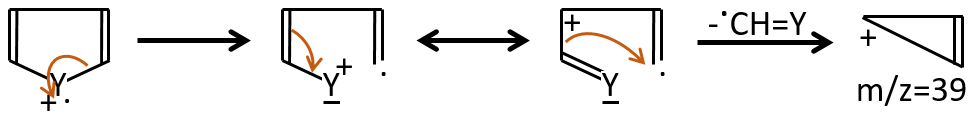
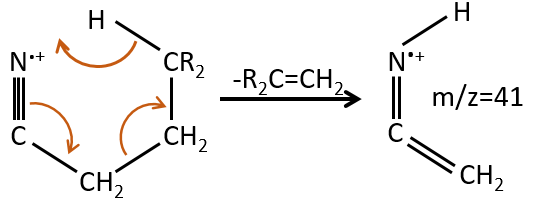
M=39: presence of a heteroaromatic atom in a cycle of 5 atoms. Several complex cleavages can occur in heteroaromatics, giving respectively the ions C3H3+ (m/z=39), HCY+ or CH2Y+.
M=41: presence of a nitrile (if Mc Lafferty).
M=44: presence of a primary amide (if Mc Lafferty).
M=46 (or 30): presence of a nitro.
M=47: presence of a sulfur.
M=59+n14 (clusters): presence of an ester.
M=60: presence of an acid (if Mc Lafferty).
M=60+n14: presence of an aliphatic nitrite.
M=61: primary or secondary -SH.
M=77: this peak is intense and is characteristic of aromatic cycles. It represents the fragment C6H5+. This peak is often in a cluster of peaks (C6H5-6-7) and is accompanied by a peak at M=91 for the toluene/tropylium ion.
M=97: presence of a nitrile (if Mc Lafferty) with a long chain able to form a cycle of 6 carbons.
The other way is to determine which particle has been lost from the parent ion (or from another fragment) to obtain the fragment we are looking at. On the spectrum of the linear alkane that we have seen at the beginning of the section, there is a regular Δm/z=14 between fragments, corresponding each time to the removal of one CH2 fragment of the chain.
It does not mean that the parent ion broke into one fragment by losing one CH2, then that that fragment loses CH2 afterwards, that itself loses CH2 etc., but that the parent ion can break at several places of the chain with a given probability proportional to the intensity of the peak. If the chain is not linear, the distances between the fragments are not so regular. It is why we can say that the spectrum of the left is the one of the n-octane and the second spectrum is the one of the 2-methylheptane.
Here comes a list of some characteristic fragments (neutral or radicals) that can be removed from the molecule:
M-15: -CH3
M-18: -H2O
M-30: -NO
M-31: -OCH3
M-33: -SH
M-45: -COOH
M-46: -NO2
The presence of halogens, spotted by the presence of intense peaks at M+2/M+4 can also be confirmed by the presence of a peak at M-X with X the mass of the halogen.
Confirmation of the composition and structure
Once we determined enough fragments (present on the spectrum and lost), we can try to puzzle them together. At this point, we should have a clear idea of the formula of the molecule. With the formula, we can determine the degree of unsaturation of the molecule. It is given by
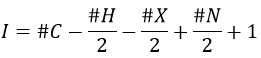
For instance, C7H7NO has a degree of unsaturation I=5. The atoms that are bivalent, such as O, are not counted. The atoms with the same valence than C, H, N and O have the same value of unsaturation. S has a value of 0, P has a value of +1/2, etc.
![]()
One unit of I represents 1 double liaison or one cycle. Triple liaisons are counted as two double liaisons. A phenyl has thus a value of 4 (3 C=C and 1 cycle).
![]()
Y can be a carbon but also a heteroatom. The molecule corresponding to the formula C7H7NO can thus be
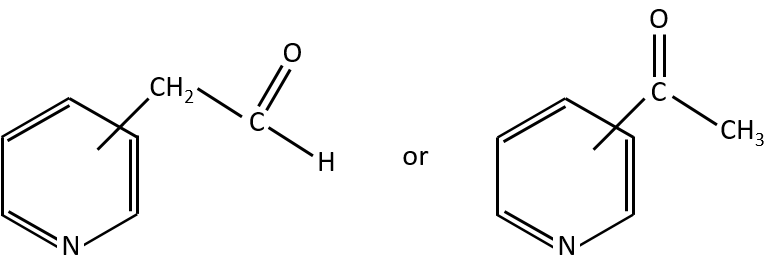
In combination with the mass spectrum, we should be able to determine which molecule it is.
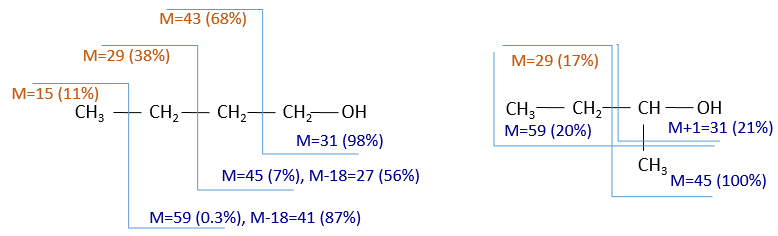
To check our guess, it can be useful to draw the molecule and cut it into its fragments. For instance, the n-butanol and the sec-butanol have two very different mass spectra. Some peaks are on the same location but their intensities are different, referring to the probability of cleavage at a given liaison. It is not necessary to explain all the peaks.
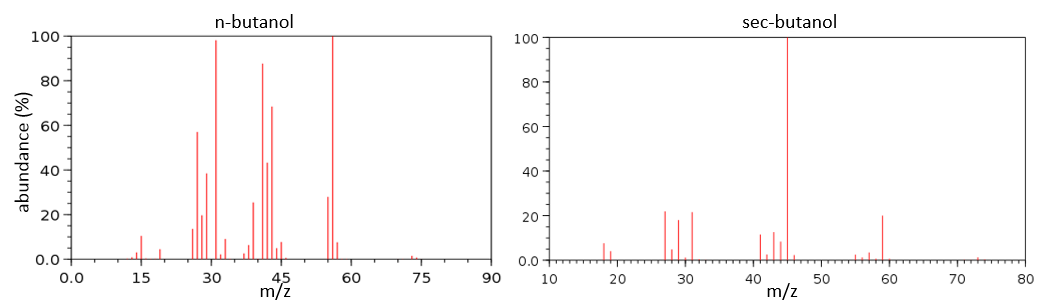
We gave here a strong resume of the mass spectrometry technique and of the analysis of a spectrum. The manual analysis of a spectrum is something that you learn by doing it again and again and that may require some guessing (sometimes some small peaks are important to determine the structure of the molecule and some intense peaks are clueless, like the peak at 56 of the n-butanol). Each group (alcohol, ether, ester, etc) have particular fragments or rearrangements and it is not the point of this section to describe all of them. It will eventually be the subject of a further section (it represents more than 20 pages in my book of reference (Spectrometric identification of organic compounds, Silverstein, Basler, Morill) and the tables for the fragments are 50 pages long, ≈150 fragments per page.
Despite its huge power, there are often several structures than can correspond to one mass spectrum. Usually, the mass spectrometry is used in combination with IR/UV spectrometry and/or NMR. Combined together, we can determine not only the structure of the molecule, but also the exact conformation. We will discuss those techniques in the following sections.